Viewing Vehicle Trip Data
Overview
The Trip Viewer feature showcases individually calculated trips on an interactive map, providing a comprehensive overview of each trip. This tool allows you to delve into specific trip details for in-depth analysis.
To access this feature, kindly follow the steps outlined below:
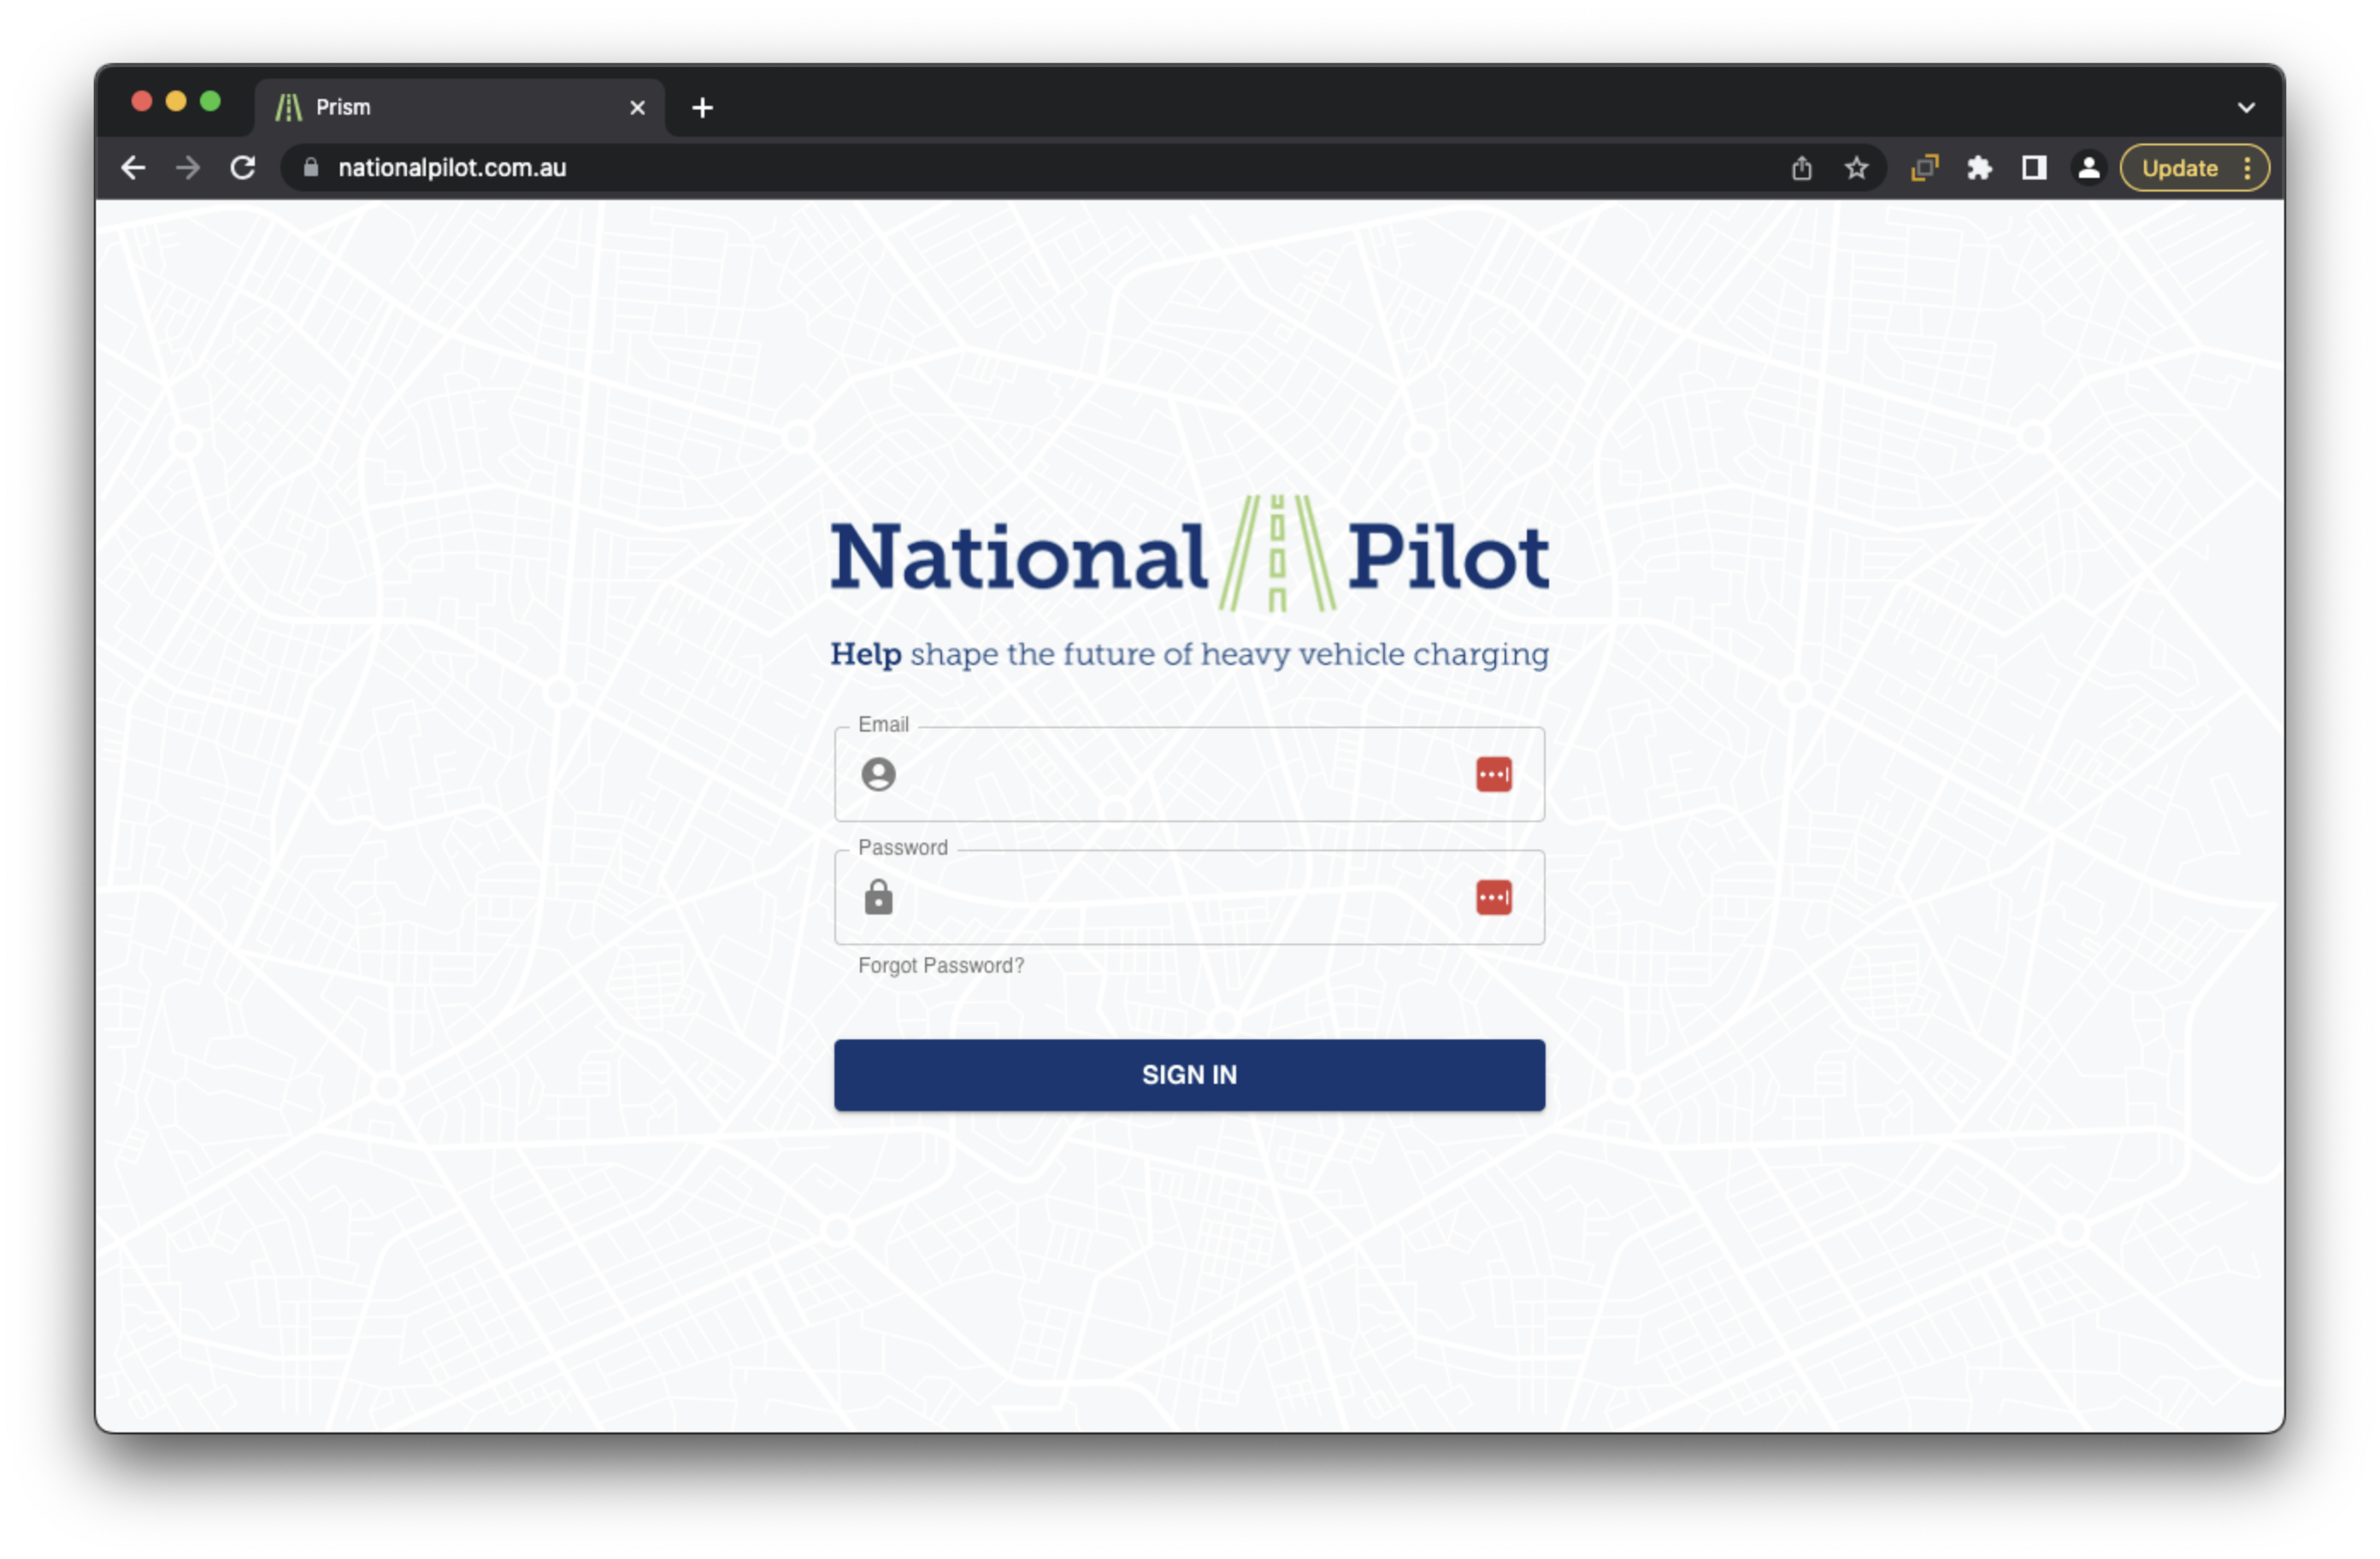
Log in to the Web Portal using your existing account credentials here. National Pilot web application
On the homepage, navigate to the Tools section and select Trip Viewer (refer to the accompanying screenshot for reference)
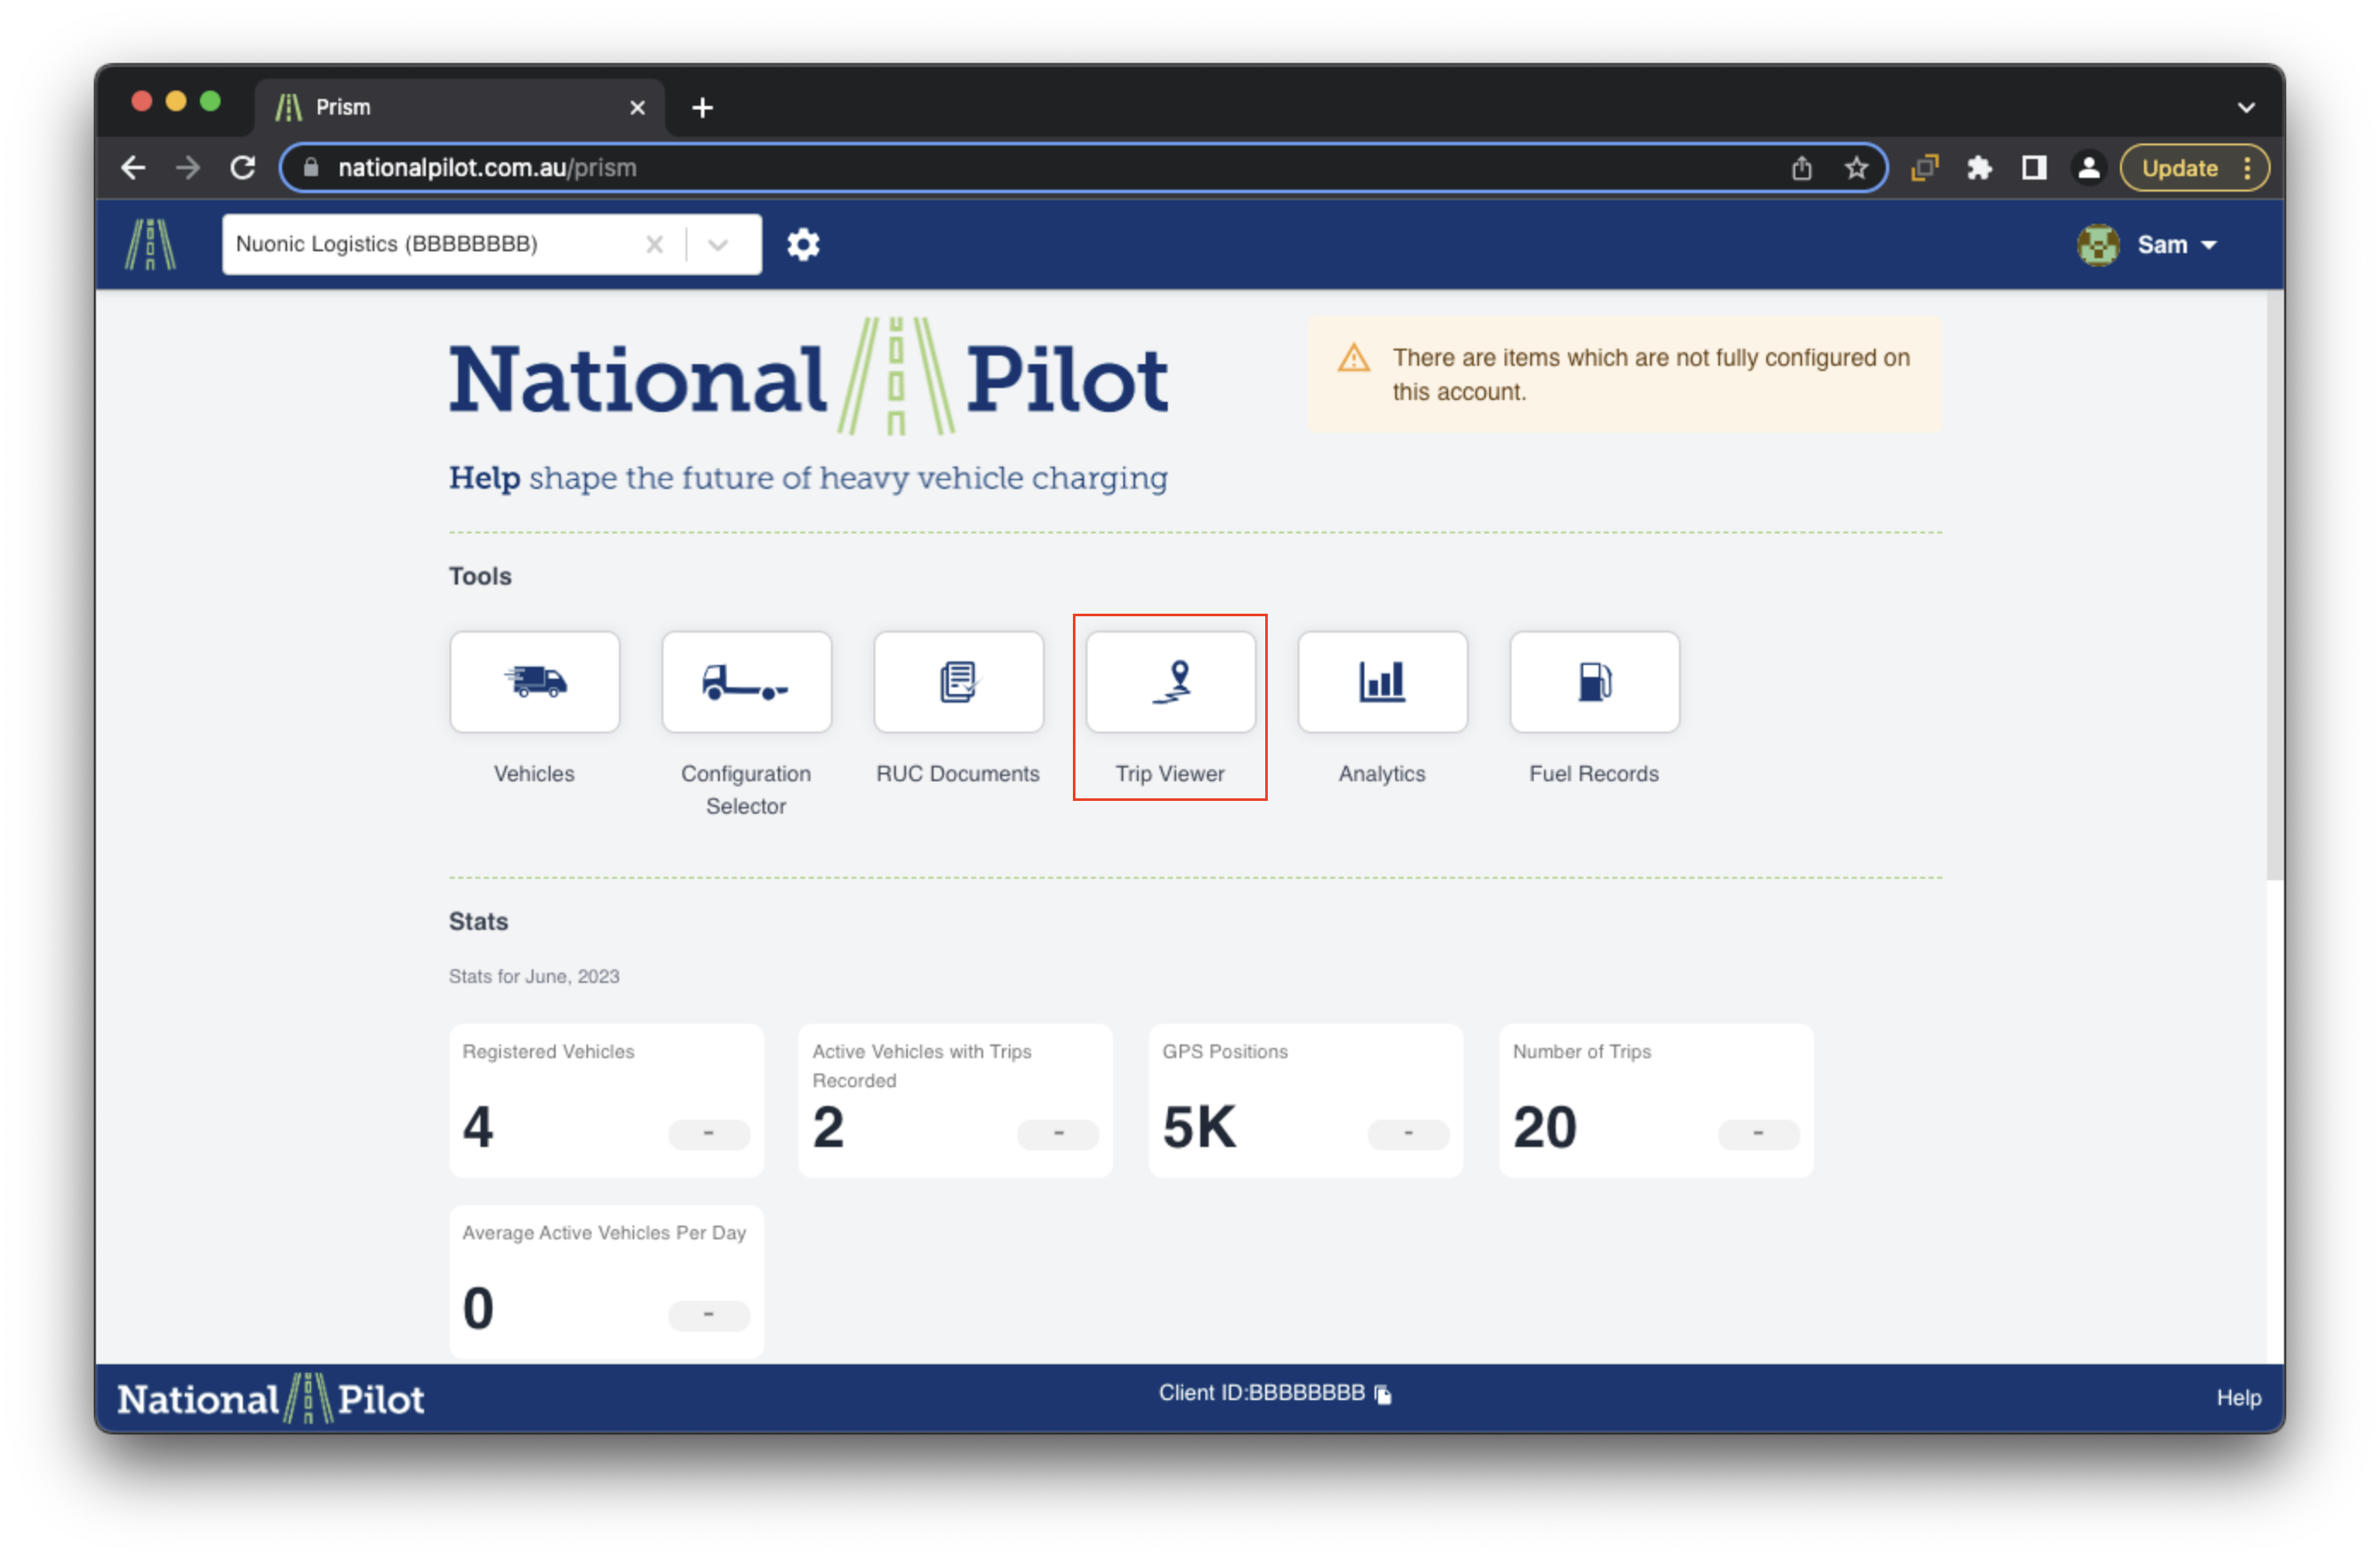
Upon selecting this feature, you will be directed to the Trip Viewer page, where you can access a comprehensive view of your trips. For demonstration purposes, please refer to the screenshot of the Trip Viewer homepage below. In this user guide, we will provide detailed explanations of each feature within the Trip Viewer for your convenience and understanding.
Filtering your trips
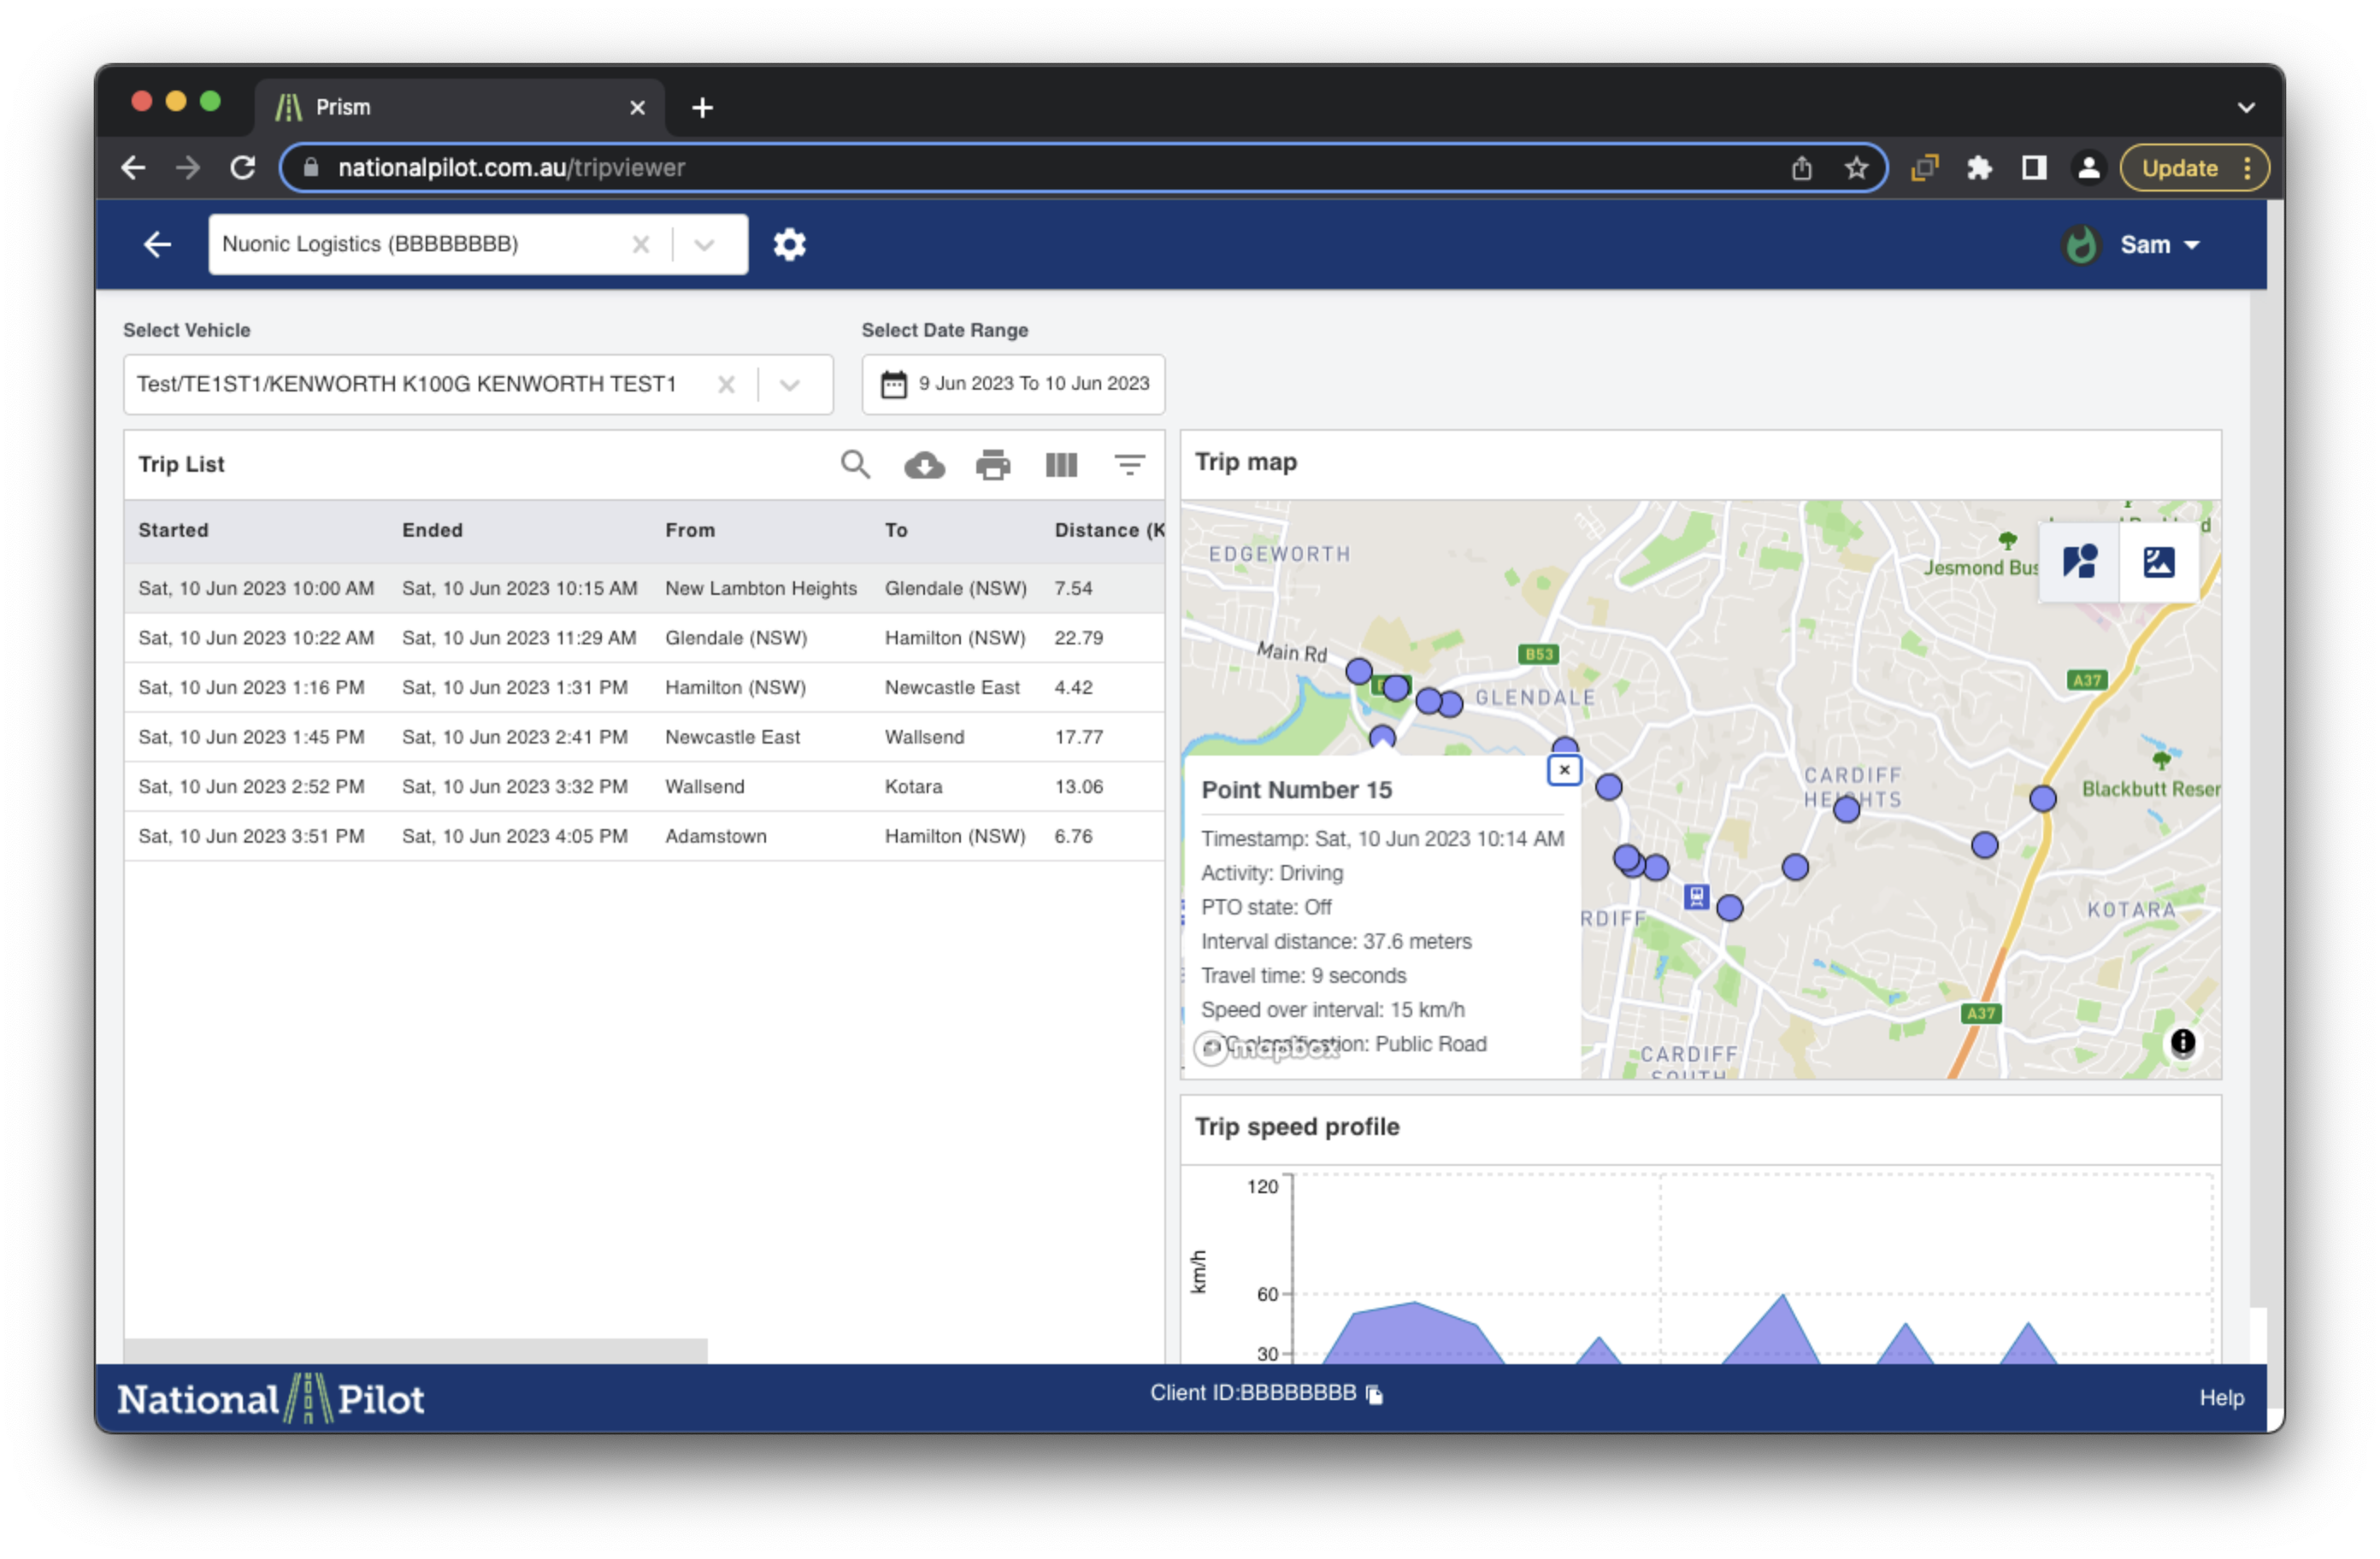
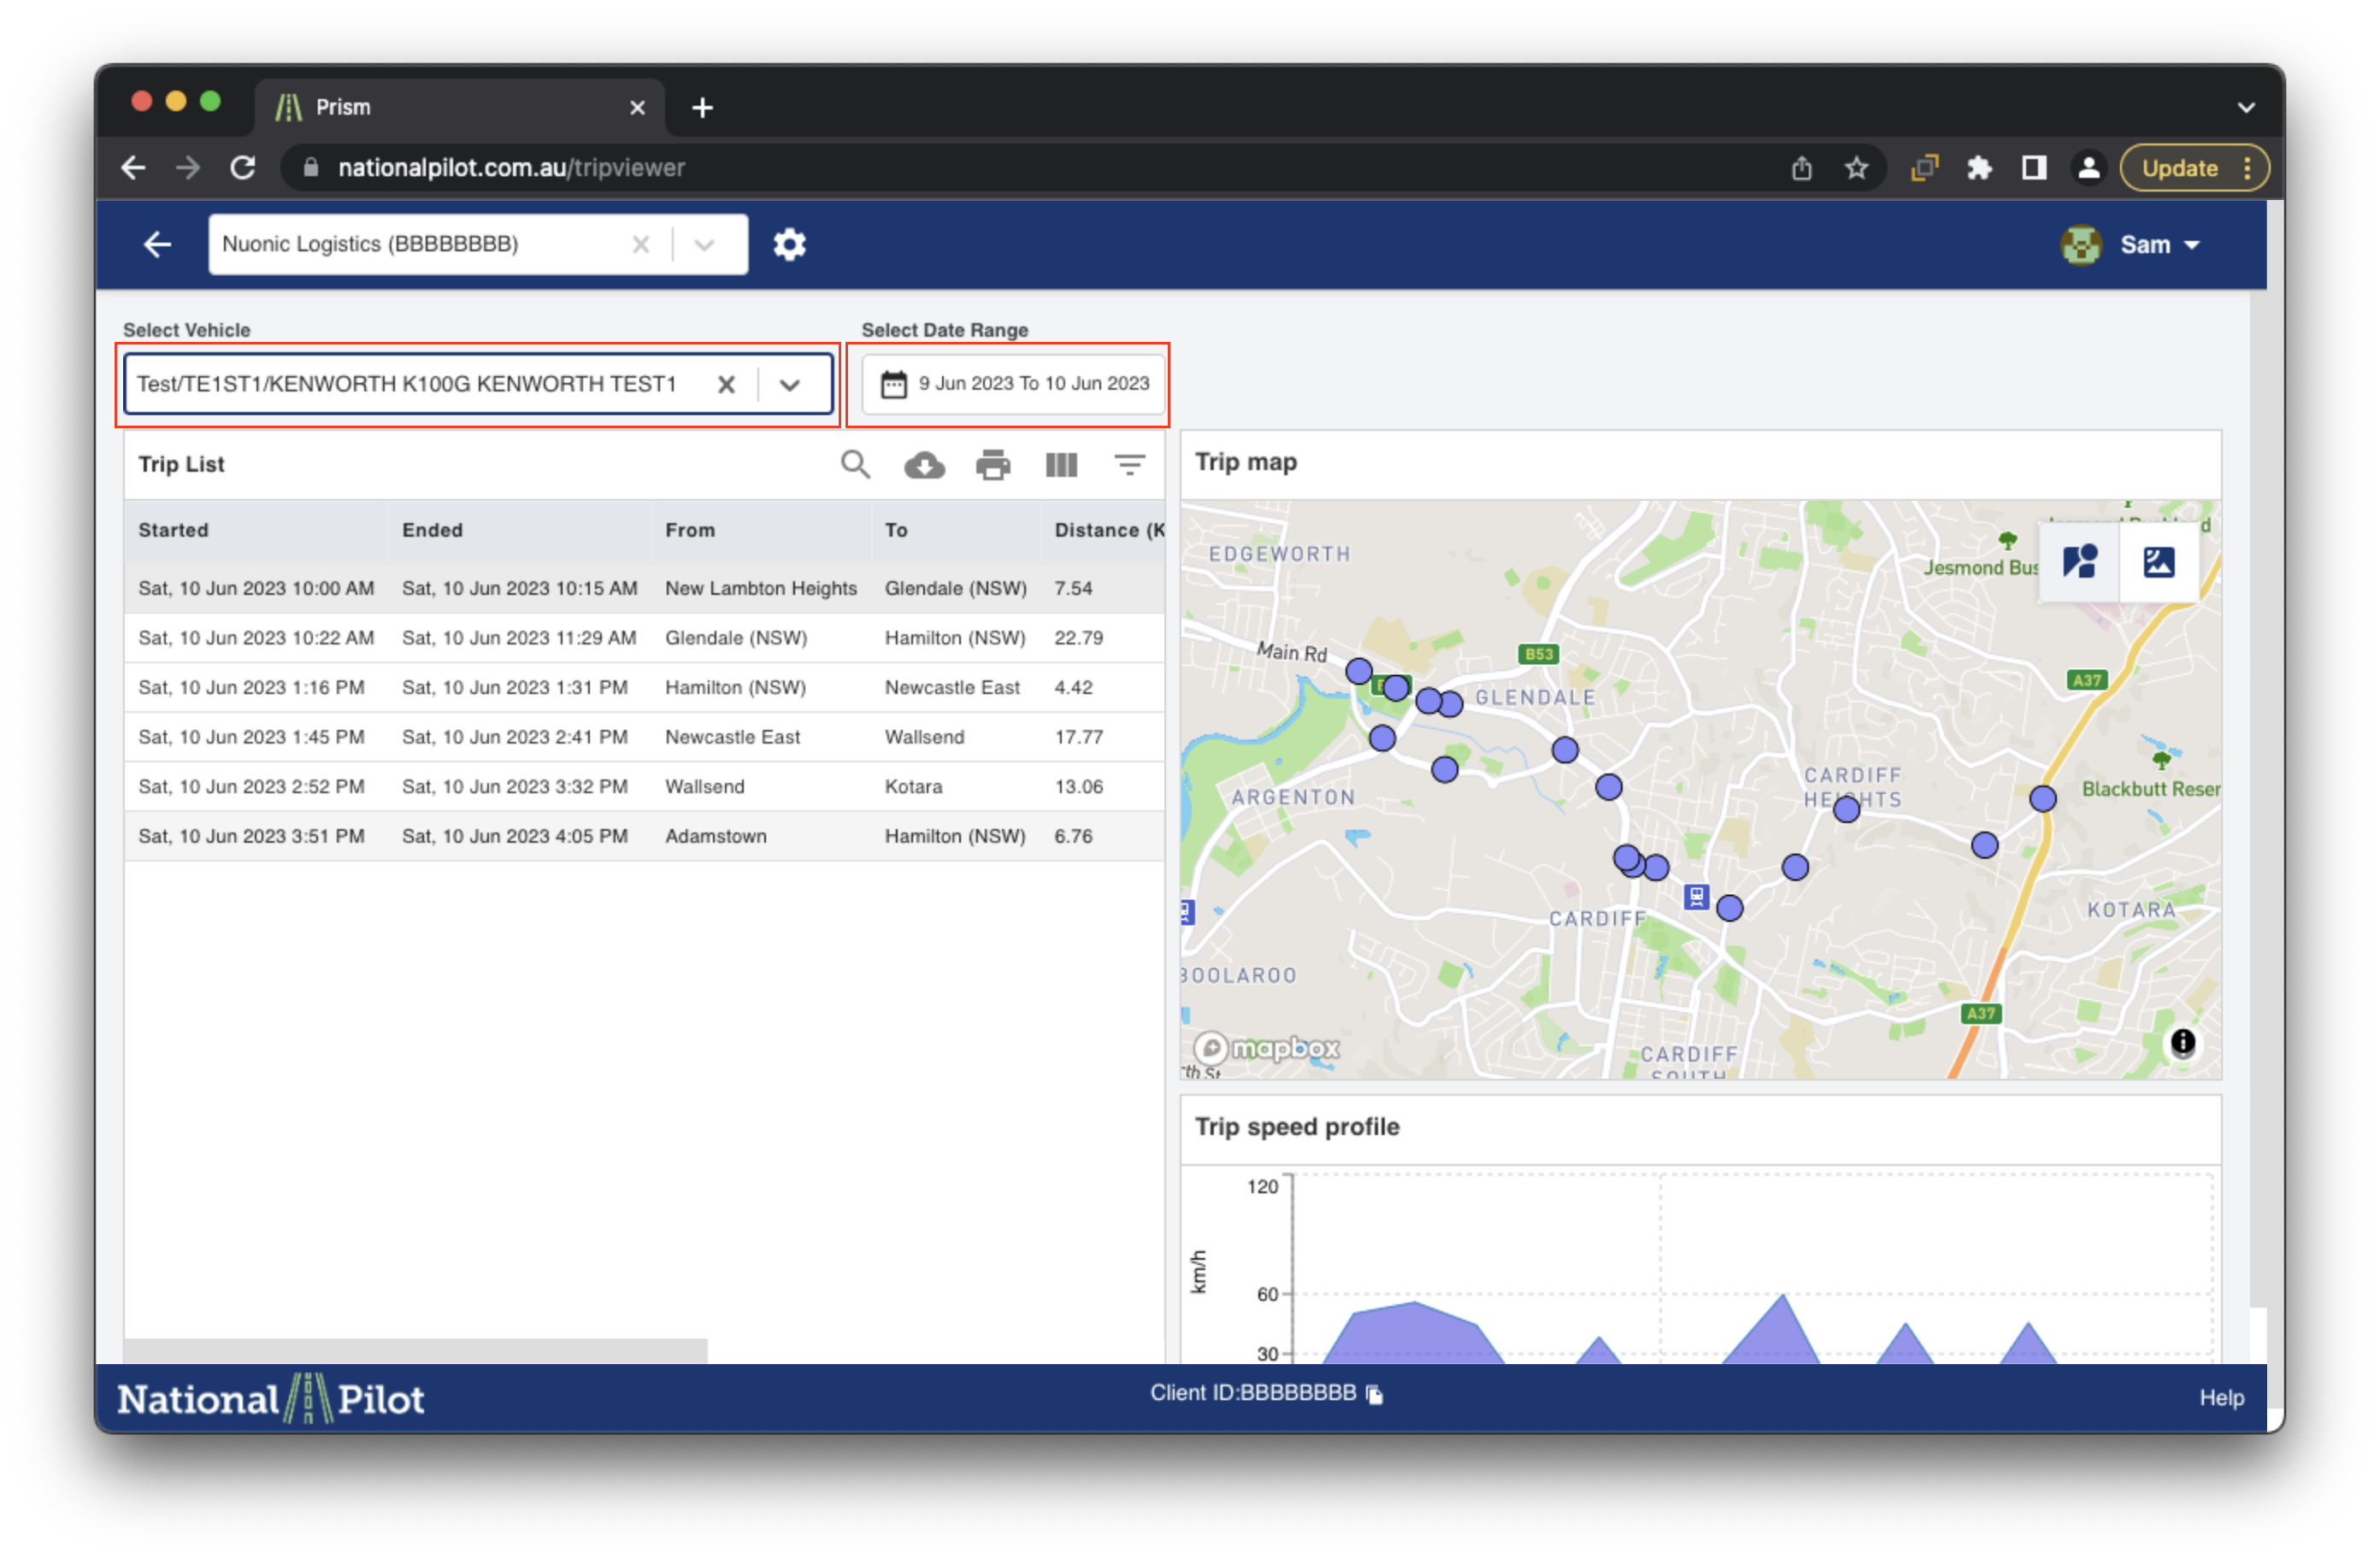
To view an individual trip, it is essential to follow these steps: select the vehicle from the 'Select Vehicle' section and specify the desired date range in the 'Select Date Range' section. These options are conveniently located at the top of the Trip Viewer page, as highlighted in the accompanying screenshot below.
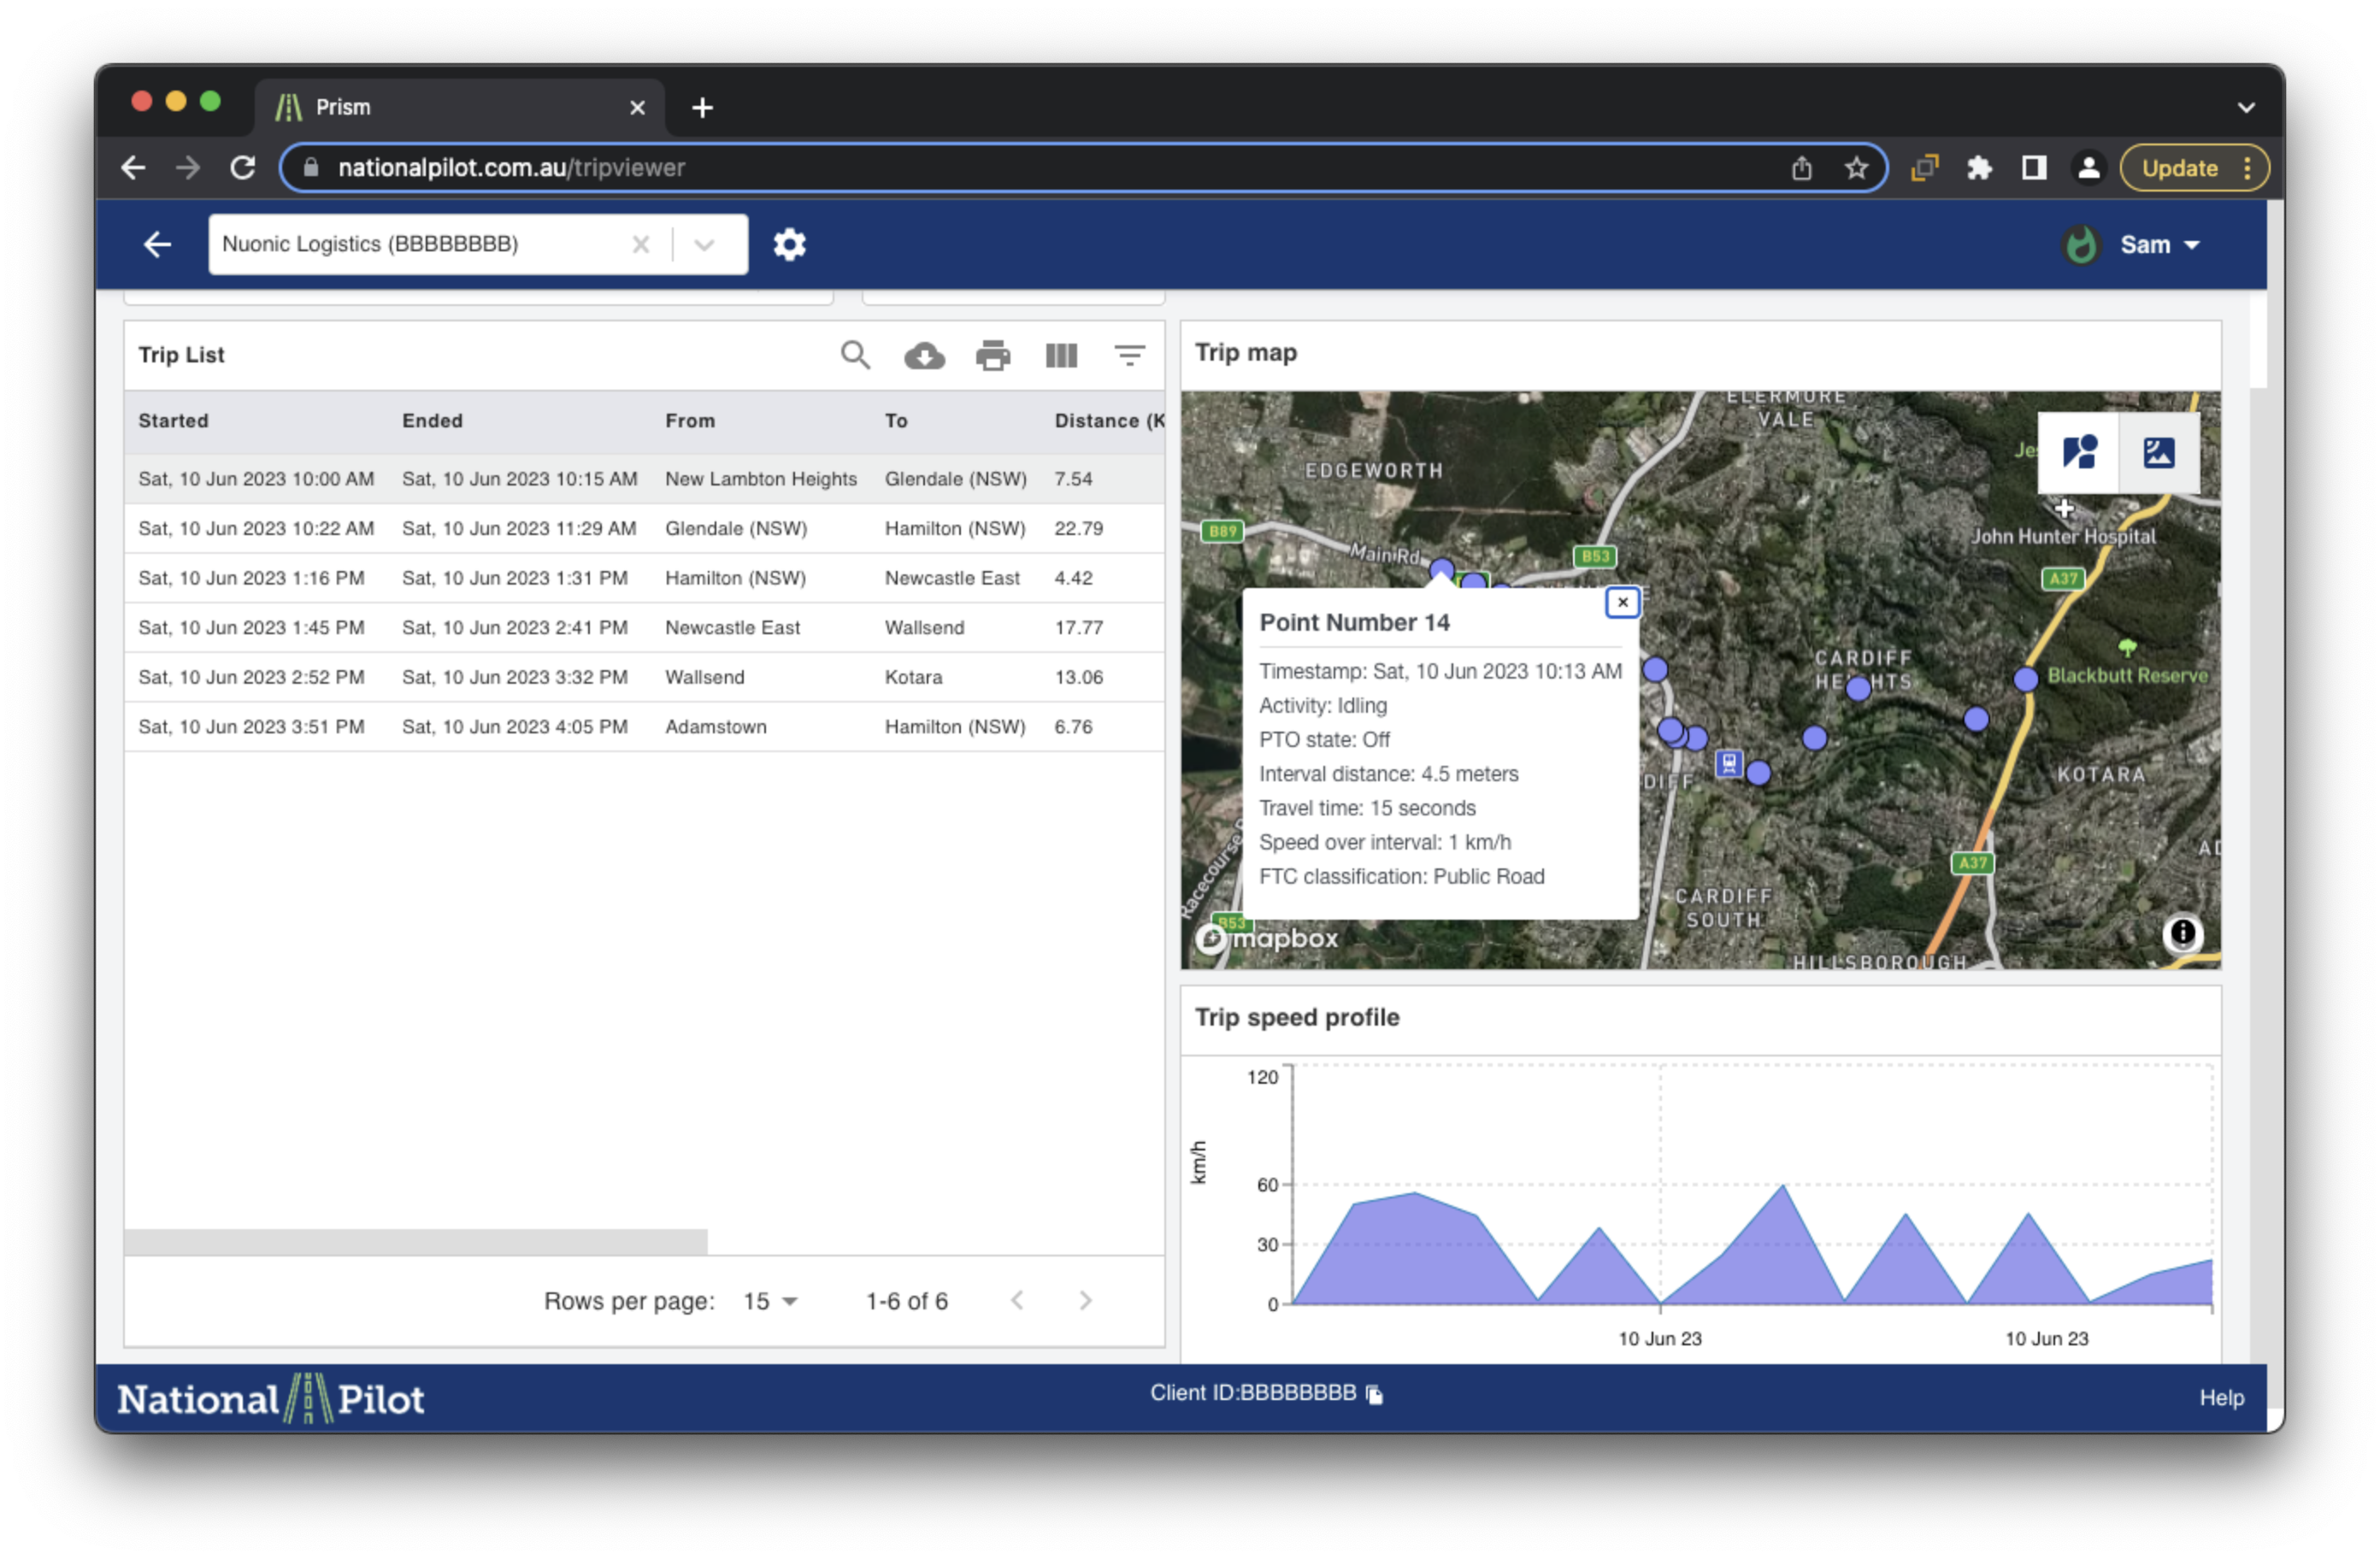
After selecting the date range and vehicle, the Trip Viewer will present a list of individual trips. By clicking on a specific trip, its corresponding details (Trip List, Trip map and Trip speed profile) will be loaded onto the map displayed on the right-hand side of the screen, as illustrated in the screenshot below.
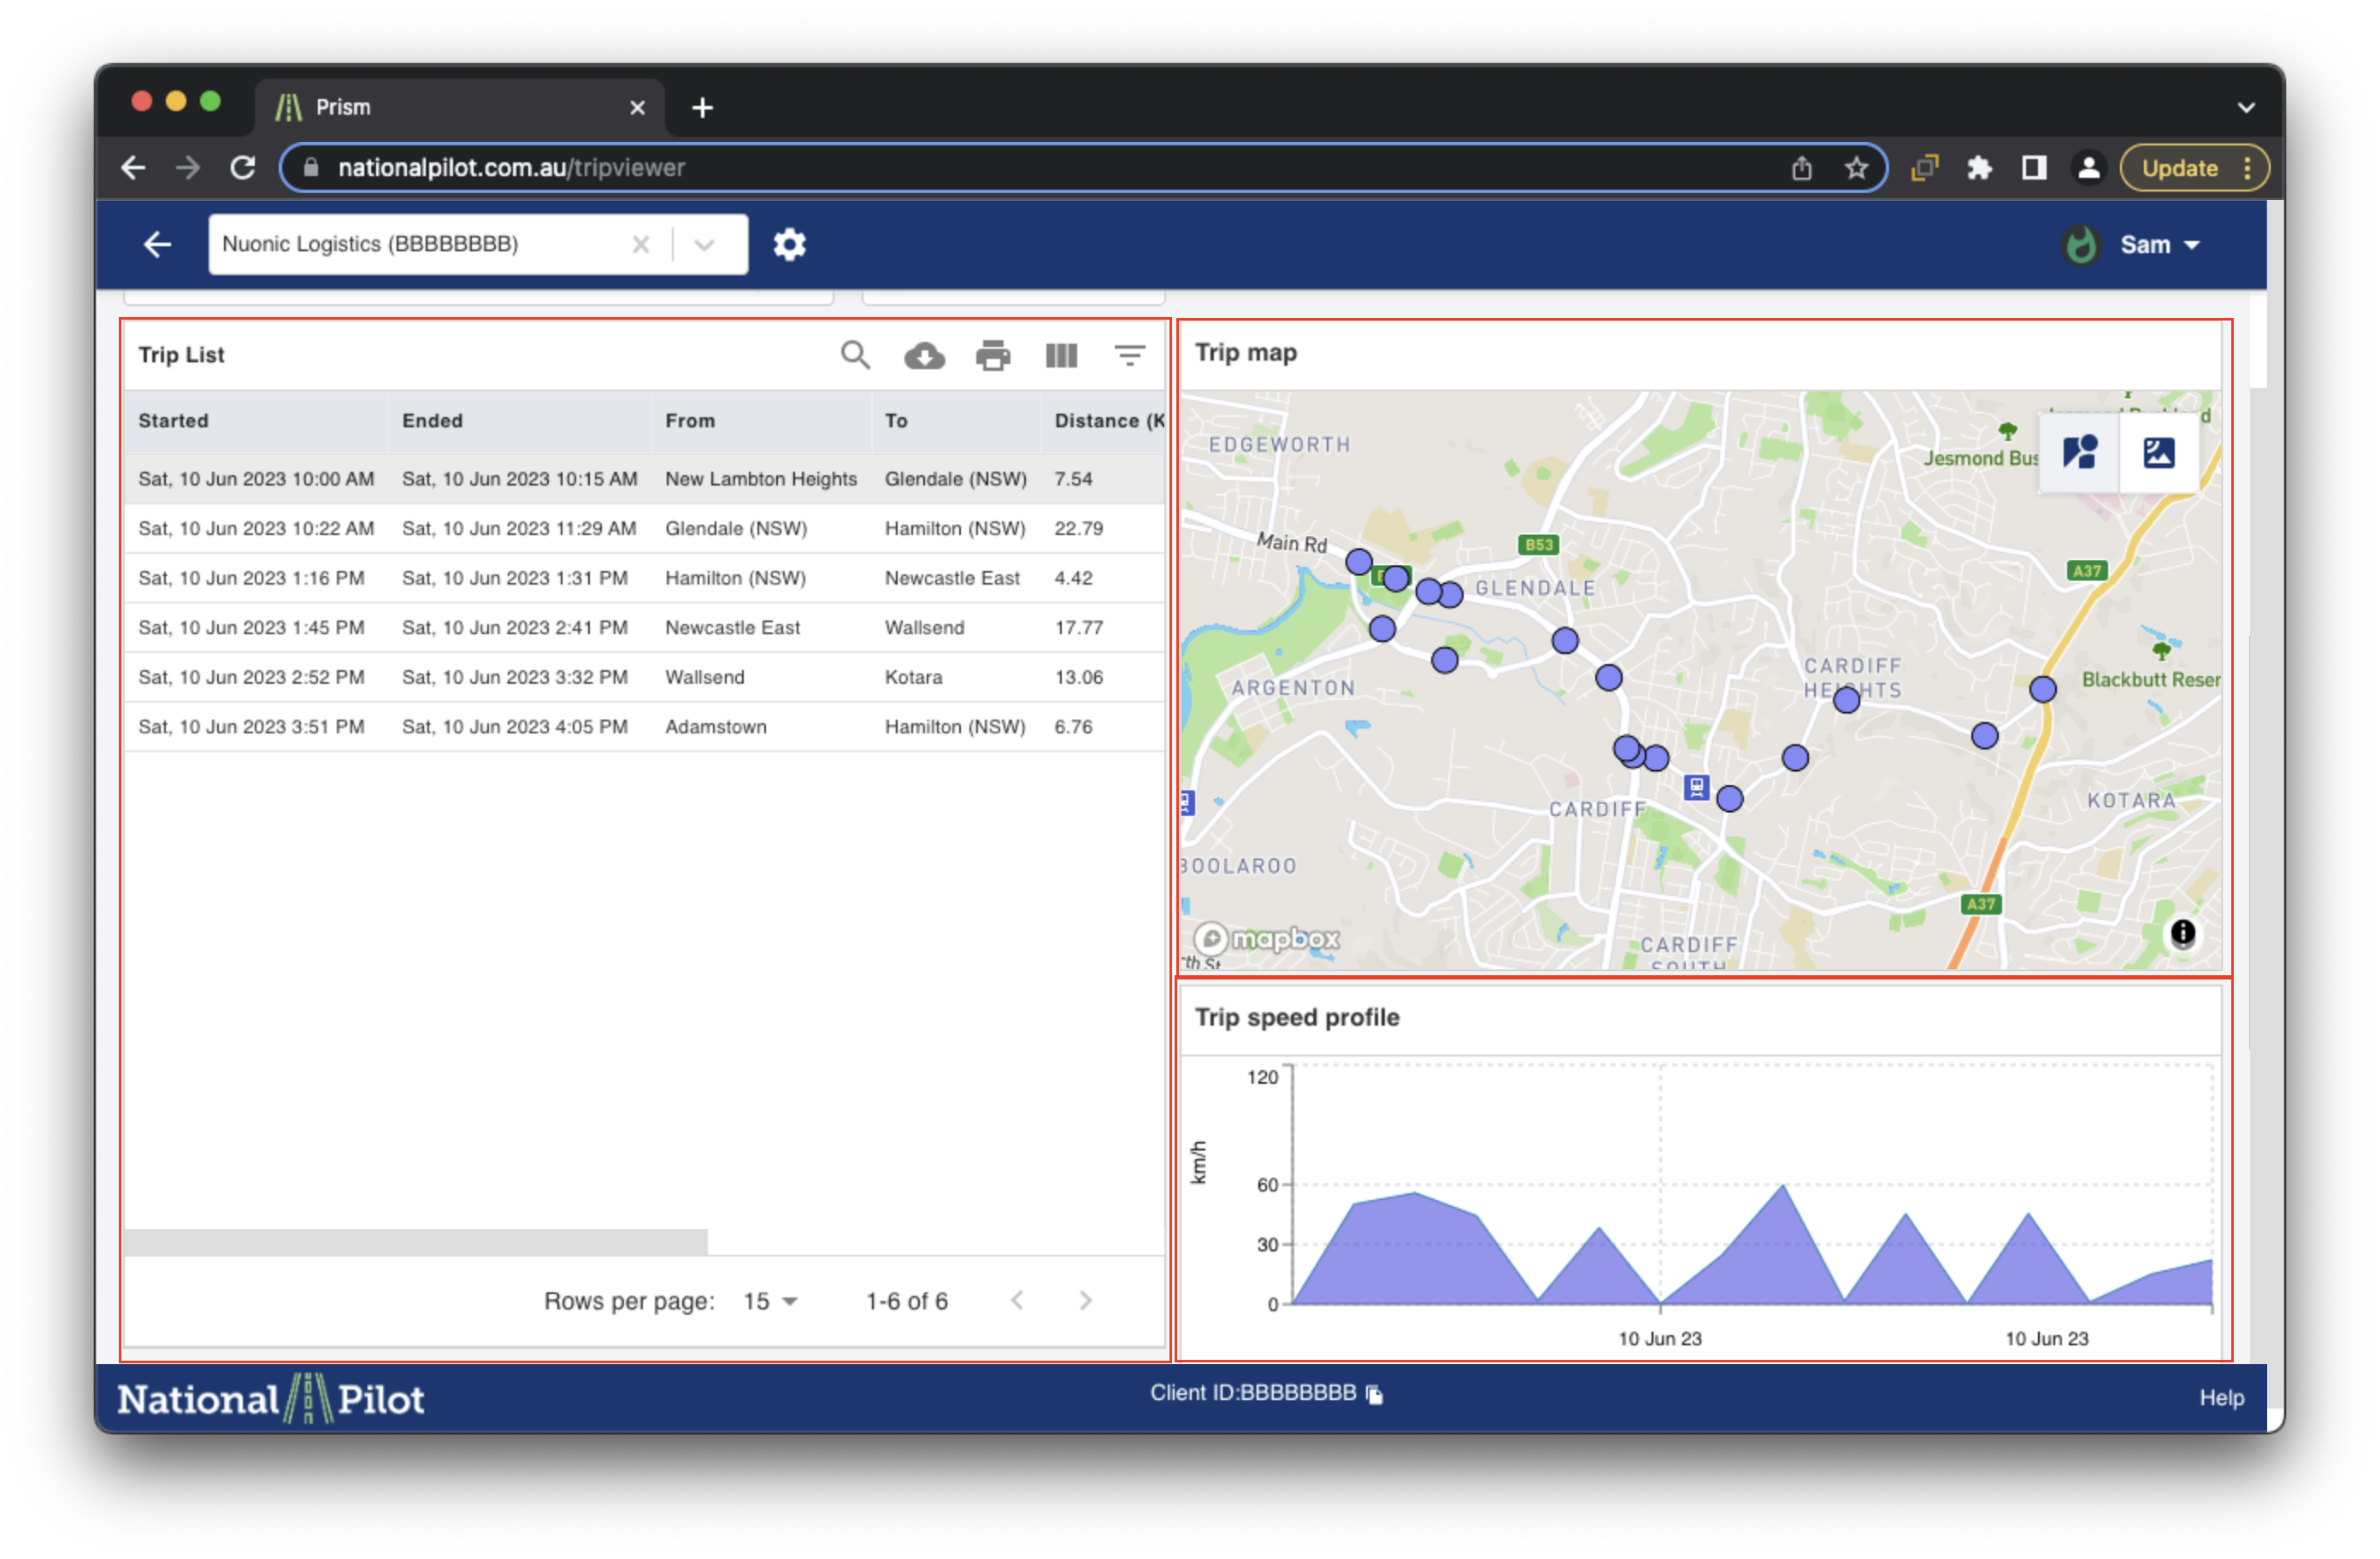
Within the Trip Map, you will observe a combination of purple and red dots denoting specific points:
Purple dots represent points on the trip that correspond to public roads.
Red dots indicate points on the trip that correspond to non-public roads.
The map offers interactivity, enabling you to zoom in for a more detailed examination of a trip using your mouse or trackpad.
For additional insights into any specific dot on the map, simply hover over it to view a concise summary statistic. Please note that these statistics are relative to the preceding point.
You can also see that the points from the map are plotted on a graph called Trip Speed Profile, which shows you the speed and time. You can also hover over each point to view the information.